Python
Visit my Github page for shared code, including a LaTeX thesis template for Master's degrees at Texas Tech and a Python class (pseudo-working) to analyzing and plotting WRF model output quickly.
Our research groups continue to use Python for a large portion of our data analysis, including post-processing WRF output, realtime data stream and computations for realtime dual doppler analyses with our two Ka band mobile radars, and displaying analyses with the matplotlib package. Furthermore, extensive computational requirements in classwork is being completed primarily with Python within our department. Various Github repos for terrific python modules that are some of my favorites and most used (list continually populated):
MetPy: Meteorological analysis and plotting capabilities
Ipython
Siphon: Unidata application for grabbing atmospheric observations through the Thredds server
xray: New way to handle netcdf data
Iris
Cartopy
PyArt: Visualizing radar sweeps, RHI and PPI types with capability to plot other data alongside the radar sweeps.
Our research groups continue to use Python for a large portion of our data analysis, including post-processing WRF output, realtime data stream and computations for realtime dual doppler analyses with our two Ka band mobile radars, and displaying analyses with the matplotlib package. Furthermore, extensive computational requirements in classwork is being completed primarily with Python within our department. Various Github repos for terrific python modules that are some of my favorites and most used (list continually populated):
MetPy: Meteorological analysis and plotting capabilities
Check out the meteogram that we integrated into MetPy for quick analyis of time series data!
SharpPY: Atmospheric sounding display formatIpython
Siphon: Unidata application for grabbing atmospheric observations through the Thredds server
xray: New way to handle netcdf data
Iris
Cartopy
PyArt: Visualizing radar sweeps, RHI and PPI types with capability to plot other data alongside the radar sweeps.
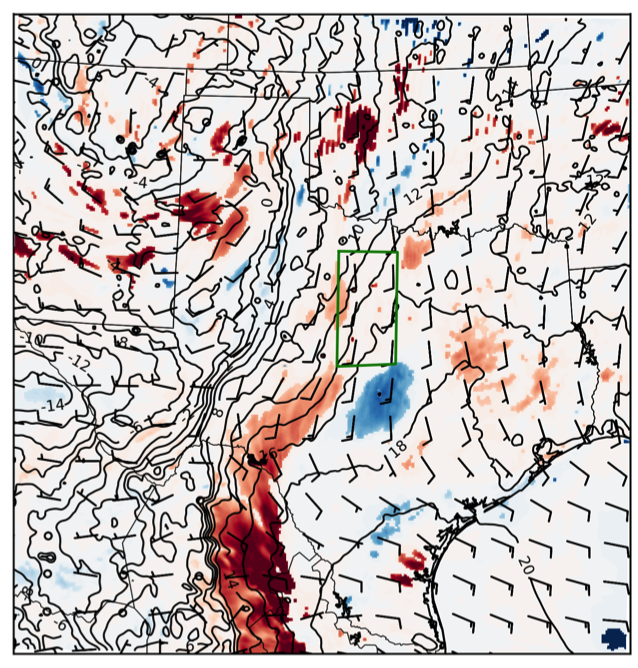
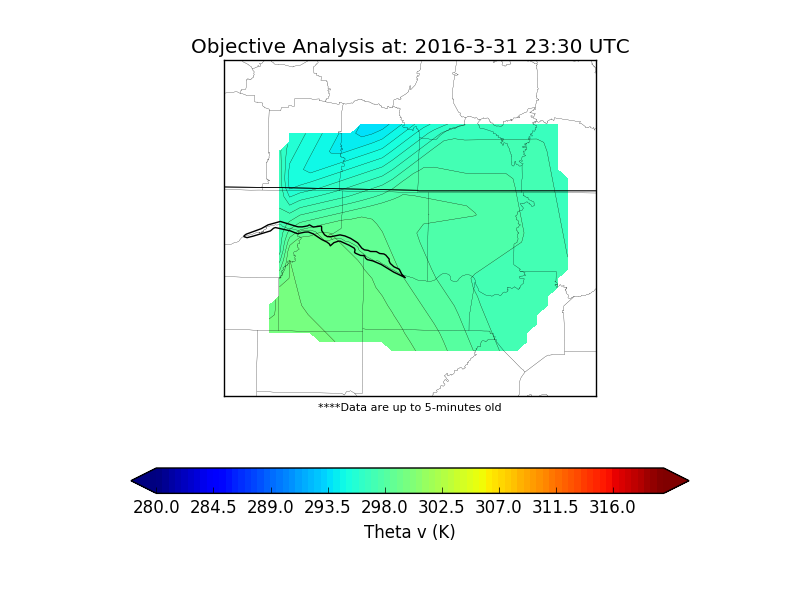
Examples