Chapter 19 Images
Supplemental images used in lecture
The (outdated) F-scale: examples of damage for each classification (courtesy: Pitt)
A reflectivity animation of a cyclic supercell thunderstorm near Kress, TX on 29 May 2001. The data are taken from the Doppler on Wheels (DOW). The core and hook echo are quite obvious. You can also see the development of circulations along the rear flank downdraft (the new mesocyclones), as old ones decay (the "occluded" mesocyclones). Courtesy Jeff Beck (TTU). (note: this is a power-point slide, load and run in slide-show mode to see the animation).
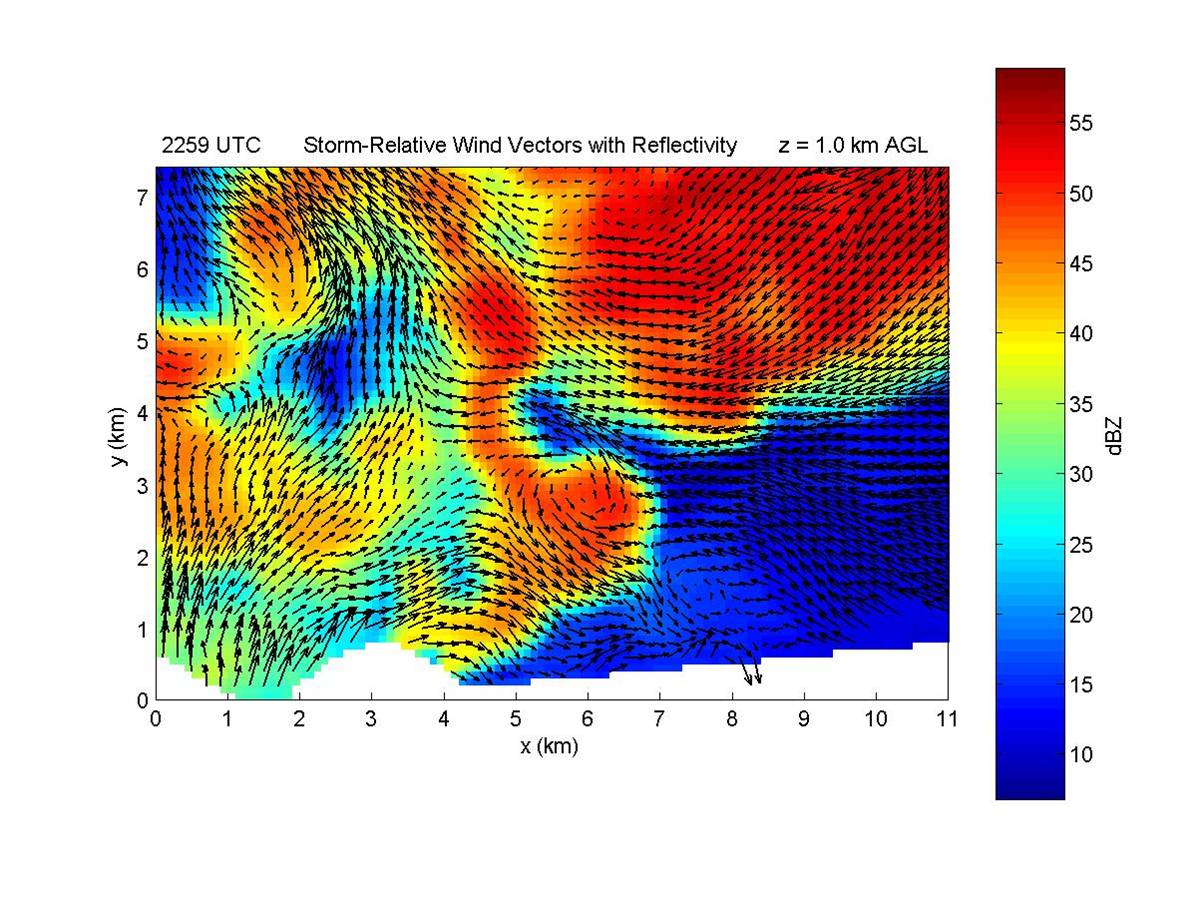
An analysis from this case showing the strong counter-clockwise circulation associated with the mesocyclones. The RFD is also very evident as a strong westerly wind (left-to-right) south of mesocyclone #2. Mesocyclone #3 is the new development. Courtesy Jeff Beck (TTU).
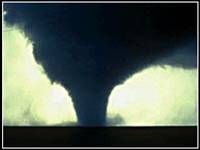
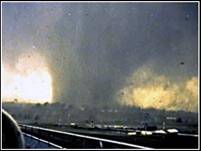
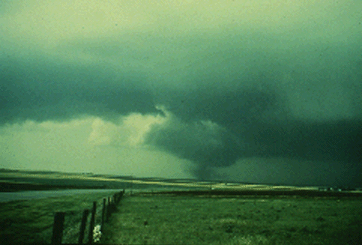
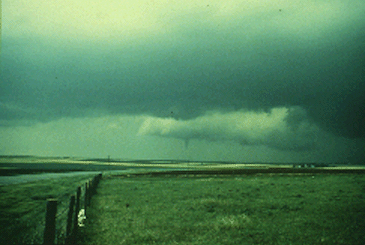
Pictures (1, 2) of a cyclic supercell. Photos taken towards the northwest. Notice how the RFD arcs out well ahead, and to the south of, the mesocyclone. Also notice the tornado associated with the mesocyclone in the background.
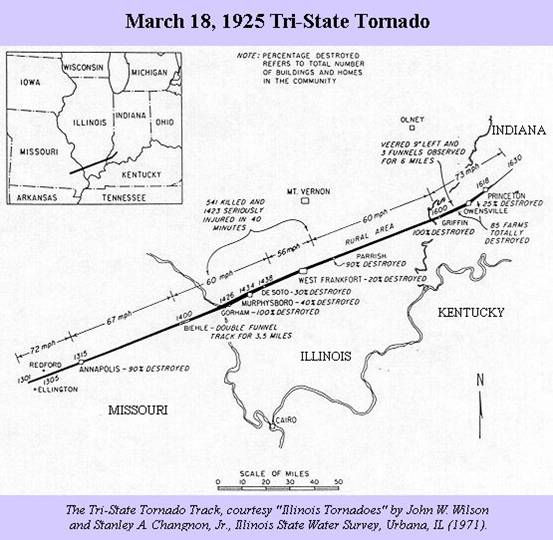
The damage path assoicated with the tri-state tornado of 18 March 1925. Though originally believed to be an enormous path of damage associated with a single tornado, it is now believed the damage was the result of a "tornado family". In other words, tornadoes associated with multiple (cycling) mesocyclones in the same supercell storm.
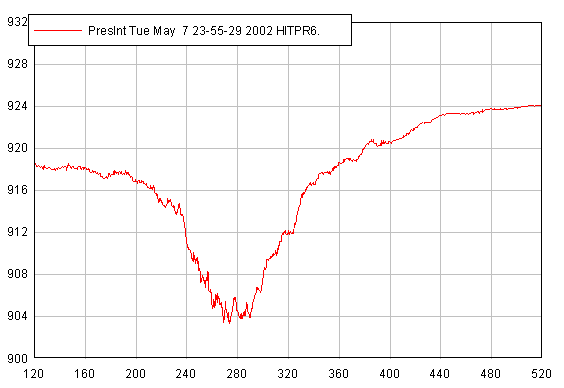
In-situ measurements of atmospheric pressure during tornado passage. This particular tornado delivered a glancing blow to the instrument. Still, you can see ~ 15 mb drop in pressure. How does this relate to the condensation funnel? (Courtesy: Tim Samaras)