Research (updated 12-30-05)
My main area of research is focused on characterizing wind flow and boundary layer structure in all types of events, including extreme events such hurricanes, thunderstorm outflows, etc., using various observational technologies. Below is a brief description of some of the research activities I am currently pursuing.
Hurricanes
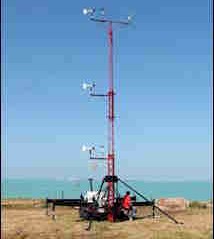 |
The boundary layer wind field of a landfalling hurricane is difficult to document. Operational based surface observation systems (such as ASOS, buoys, C-MAN stations, etc.) often fail due to power loss or system damage. In 1998, recognizing this critical data void, Texas Tech University (TTU) committed to the development and deployment of structurally reinforced mobile instrumented towers to gather high-resolution meteorological data from landfalling hurricanes. This information yields better forecast validation and a starting place for post disaster investigations. To date, the towers have been used in 24 different landfalling tropical cyclones, and the project continues. The towers collect high-resolution (nominally 10 Hz) wind speed and direction data from multiple levels, as well as barometric pressure, temperature and relative humidity. The data have been validated, and assimilated into a database, and continue to be used to examine hurricane wind flow characteristics. Time histories from several storms are available here. Several publications have resulted from this general effort; please check my publication list for the most up to date information. |
|
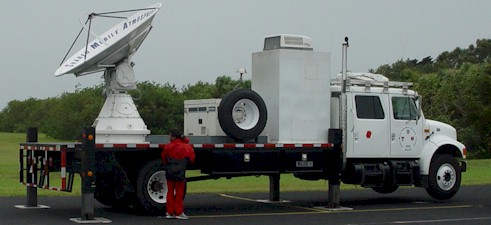
Recognizing the limitations of using only 10 m tower data to characterize the near surface wind flow variations, TTU started to gather coupled radar/tower data sets in 2003. While some historical work compared the tower data to WSR-88D radar data, more recent work has been focused on using data from the Shared Mobile Atmospheric Research and Teaching (SMART) Radars in tandem with the mobile tower data to address specific scientific unknowns. Of particular interest to me are the linear coherent boundary layer features previously noted by some researchers, transition of the wind field at the coastal interface in response to changing surface roughness (water to land), and general microscale variability in the near surface wind field. |
 |
 |
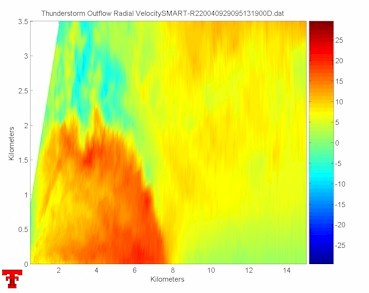
Various researchers have identified coherent linear features (rolls/streaks) in the hurricane boundary layer. These features lead to relatively small-scale velocity perturbations in the general wind field, and yet their structural characteristics, evolution, intensity and overall effect on the surface level wind field are still largely unknown. Coupling SMART radar data acquired from Hurricanes Isabel (2003) and Frances (2004) with accompanying tower data provides an opportunity to document these features and their effect. Various methodologies have been developed to extract the wind speed perturbations associated with the features from the general wind field, and provide relevant filtering and thresholding to highlight their structure. The figure to the left shows radial velocity residuals (in m/s) after the removal of the mean wind field using a modified velocity azimuth display (VAD) technique. The small-scale linear features are clearly evident. The near surface wind direction is this case is from the northeast, and the long axis of the velocity perturbations are almost aligned with the mean wind. The modified VAD method has also been coupled with data from range height indicator (RHI) scans to evaluate the vertical depth and coherency of the features. This work is in a preliminary stage, but some initial results can be found in various conference proceedings. |
|
The
scientific and engineering communities have an inherent interest in
how fast the wind field adjusts to the land surface in the onshore
flow region of a landfalling hurricane.
The idea is to use research radar
to acquire reasonable estimates of the meso and
microscale variations of the wind field across the interface, and
couple tower data to provide ‘ground truth’ and enable the evaluation of
turbulence characteristics. The
image to the right was obtained using the SMART radars in Hurricane |
|
Thunderstorms
 |
For the majority of the country thunderstorms (not hurricanes) provide the highest risk for receiving a severe wind event. So it is important to understand the microscale structure of outflow events associated with thunderstorms as well. To document thunderstorm outflow structure as well as other high wind events, TTU has setup arrays of instrumented towers at our Reese Technology Center field site over the past few years. The tower arrays were located near the 200 m Wind Science and Engineering tower and the West Texas Mesonet surface observation station and radar profiler. Several significant events were observed, including the rear flank downdraft of a nearby supercell thunderstorm on 4 June 2002. The figure to the left shows the averaged wind speed time histories from the thunderstorm outflow as measured across the the linear array of seven meteorological towers which were aligned from north to south with a spacing of about ~263 m. This case study was included in a recently submitted paper to the Journal of Wind Engineering and Industrial Aerodynamics. Additional work continues as we continue to compare the micro and turbulence scales of winds from various atmospheric conditions (hurricanes, thunderstorms, frontal passages, etc.). |
|
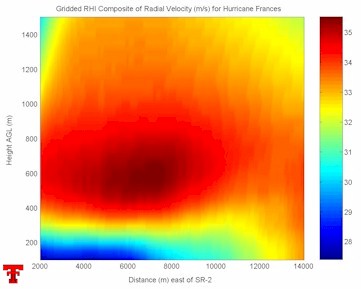
Research radar can also be used to extract meso and microscale structure from thunderstorm outflows as well, given enough scatterers are present. While this work has really just begun here at TTU, we hope to complete more in the near future. An initial data set was acquired in September 2004 to show the effective use of research radar to evaluate outflow characteristics. The figure to the right shows a gridded snap shot of an outflow boundary sampled using a repetitive RHI scanning strategy. The outflow boundary is moving from left to right in the image and is about 2 km deep. From the image, one can imagine the different shear profiles that might be found in the lower atmosphere as the gust front propagates by a given location. Shear instabilities on the top of the outflow are easily evident. A low level jet (LLJ) structure sets up as the gust front continues to propagate away from the radar. These type of events are important to the wind energy community, as turbines must be designed to resist the fatigue loads resulting from LLJ's and thunderstorm outflows. |
|
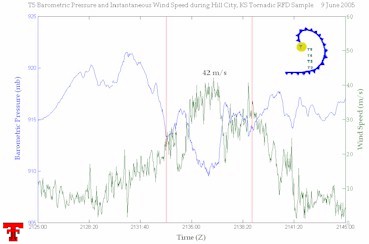 |
Another area of focus is using mobile mesonet platforms to make kinematic and thermodynamic measurements from varying atmospheric events. Over the past 2-3 years, TTU has used four mobile mesonets, in association with a graduate level course focused on conducting relevant atmospheric field experiments, to observe various characteristics from drylines and the RFD's of supercell thunderstorms. One successful RFD deployment occurred when the team intercepted a tornadic supercell south of Hill City, Kansas on 9 June 2005. The figure to the left shows the wind speed and barometric pressure trace as observed by one mobile mesonet (T5) as the tornadic circulation passed just to the north of the vehicle. This data set is documented in a paper which is about to be submitted to Weather and Forecasting. |